To create optimal site content and best measure its success, it is crucial to define the relationship between your KPIs and your content.
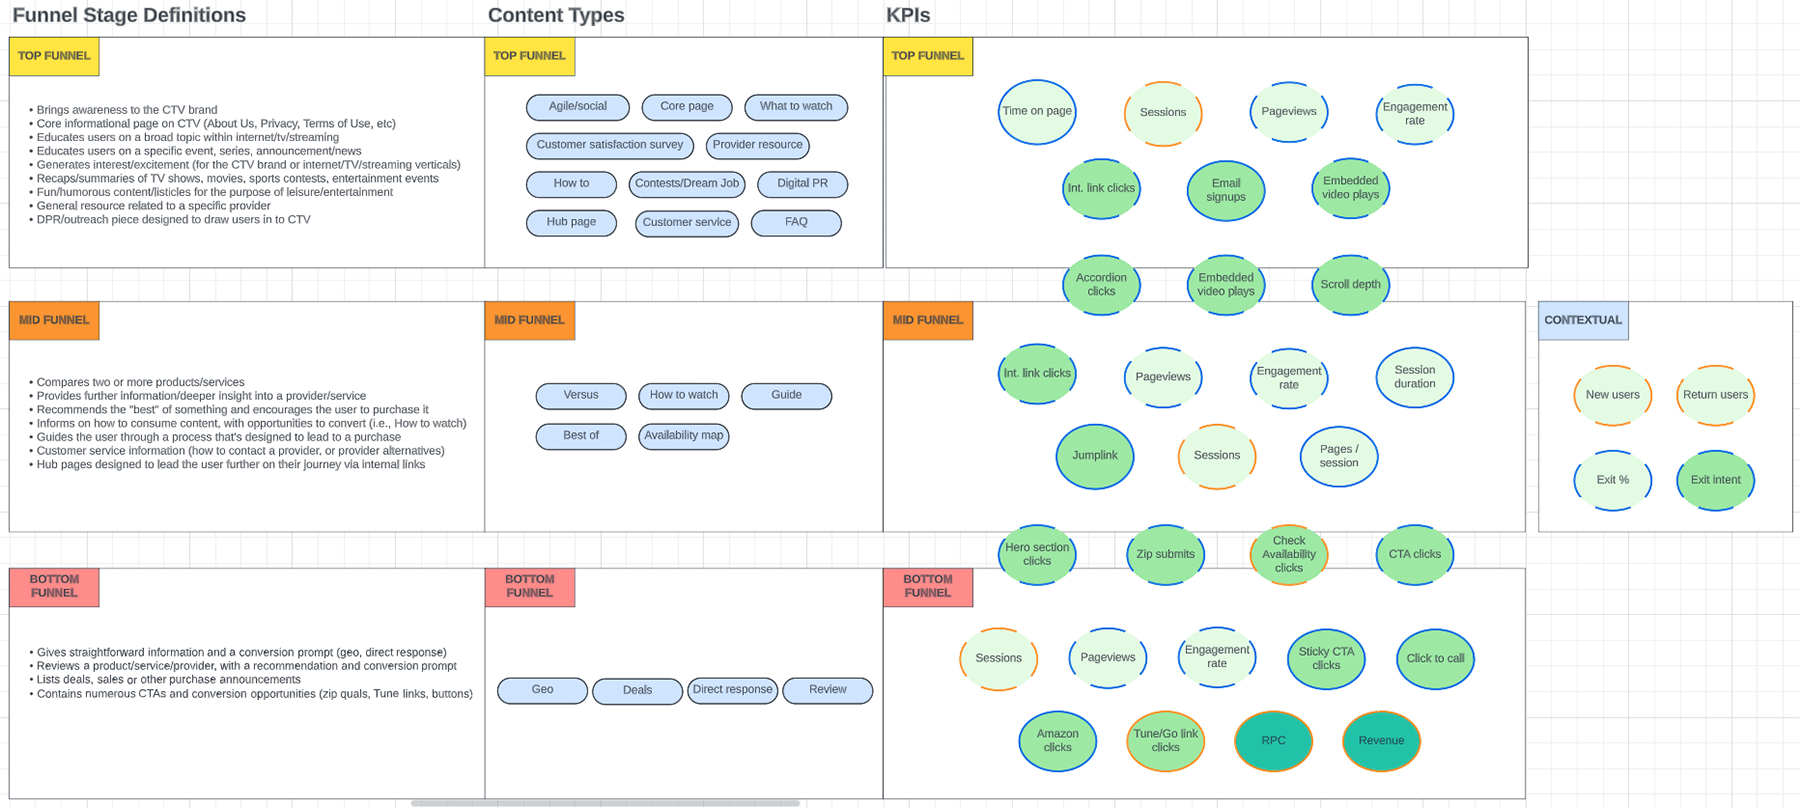
With these relationships defined, you know which KPIs you need to optimize for as you create and format your content. On a project for CableTV.com (CTV), I mapped our core KPIs to funnel stages and content types.
Below you can see the mapping chart I created for CTV detailing these relationships:
(Click to see larger)
There are different ways to define the KPI/content relationship, but creating a simple visual such as the above example is a great way to get started.
The basic steps for this process include:
- Define what top, mid, and bottom funnel means for your website.
- Define all KPIs you want to measure and ensure you are able to track each one.
- Define each of your content types.
- Map each content type to the appropriate funnel stage.
- Map each KPI to the appropriate funnel stage.
You'll likely find that some KPIs align with multiple funnel stages and content types. This is to be expected and is one of the tricky aspects of this exercise—much of it is contextual depending on the page and user intent. Try not to overthink it. The goal is not to have everything placed perfectly, but rather to gain a broad understanding of how your KPIs relate to your content.
If desired, you can take this a step further by including additional site metrics or methodologies in the mapping process. You may also want to add visual formatting to your final deliverable to convey info such as data location, KPI ownership, or other types of metadata (more on that in the demo video below).
Having these relationships defined and presented clearly for future reference will go a long way in helping you and your team create, manage, and optimize your site content for success.
KPI Mapping Demo
For more details of the KPI mapping project I completed for CableTV.com, check out this short demo:
Questions? Email me at nathanbrown.ux@gmail.com.